Shipping and CO2 - The Big Picture - Part 1
This was originally published on Linkedin in November 2017. Errors, omissions and poor use of data are my own.
In the aftermath of the Paris Agreement at COP21, much was made of the decision to leave out shipping, and this has served to highlight the various factions amongst the stakeholders of the shipping industry. The debate has of late become ever more polarised, and has even been picked up by the non-specialist press (though with accompanying inaccuracies and misunderstandings, but perhaps not surprising in this day and age).
Research and studies have been conducted by all involved, but we still end up with completely opposing claims - one group claiming ships have never been more efficient (generally measured per unit cargo), and others claiming that ship efficiency is stagnant, or even getting worse. Are they all measuring the same thing, speaking the same language, using the same definitions? Possibly not. But the situation is also not helped by the problem we have that most of the efficiency indicators do not properly measure actual ship efficiency for a variety of reasons - mainly to do with not accounting for the varying operating profile of most ships; and badly flawed input data.
So how do we get the big picture view that allows us to understand and perhaps evaluate both these opposing viewpoints?
The ICCT (International Council for Clean Transportation) recently published their report into shipping's CO2 emissions that fills in the figures for 2013-2015, picking up where the data for the 3rd IMO GHG study ended. This is a period that is hugely interesting for the shipping industry as it is a sort of overall scorecard for how the sector has been performing - at a time where more and more ecoships entered the fleet together with widespread awareness of energy efficiency. The period also covers the large drop in bunker price in Q3 2014.
The methodology for CO2 inventories have changed slightly and AIS coverage has also improved, but the numbers are I think meant to be compared to the 3rd GHG study since the same methodology is used. The report updates even the numbers for 2008-2012 so they are not identical to the 3rd GHG study. In graphical format for international shipping we get:

That looks a bit like CO2 reduction stagnating. To try to avoid any bias in this, let's present the full picture from 1990 (as far back as I could find data, though I'm not sure the methodologies are the same - draw conclusions and comparisons with caution)

Source: 2nd IMO GHG study + ICCT
A different picture emerges when we go back further - there certainly appears to be a break in the long term trend post 2008. We certainly can't explain this in terms of regulation - EEDI came into force for ships built after 1 Jan 2013, so delivery would have been in 2014 or later, and new ships only account for around 2-3% per annum as a proportion of the entire world fleet.
UNCTAD helpfully produces a yearly review of maritime transportation which is a fascinating treasure trove of statistics and figures. In amongst all the detail, they provide shipping demand in tonnes loaded and tonne miles.

There is a slight dip in 2009 (not entirely unexpected) but the long term trend is upwards. UNCTAD doesn't publish data for every year prior to 2005 for tonnes loaded, but every 5 years. To provide context to the CO2 figures shown earlier, in 1990 they recorded about 4 billion tonnes loaded (4000 million tonnes in the chart above), in 1995 it was 4.6 billion tonnes loaded and in 2000 it was about 6 billion tonnes loaded. We are shipping about 2.5 times the amount of cargo (containers, bulk, oil & gas) in 2015 compared to 1990. In the same period world population grew from 5.3 billion to 7.4 billion. Make of that what you will.
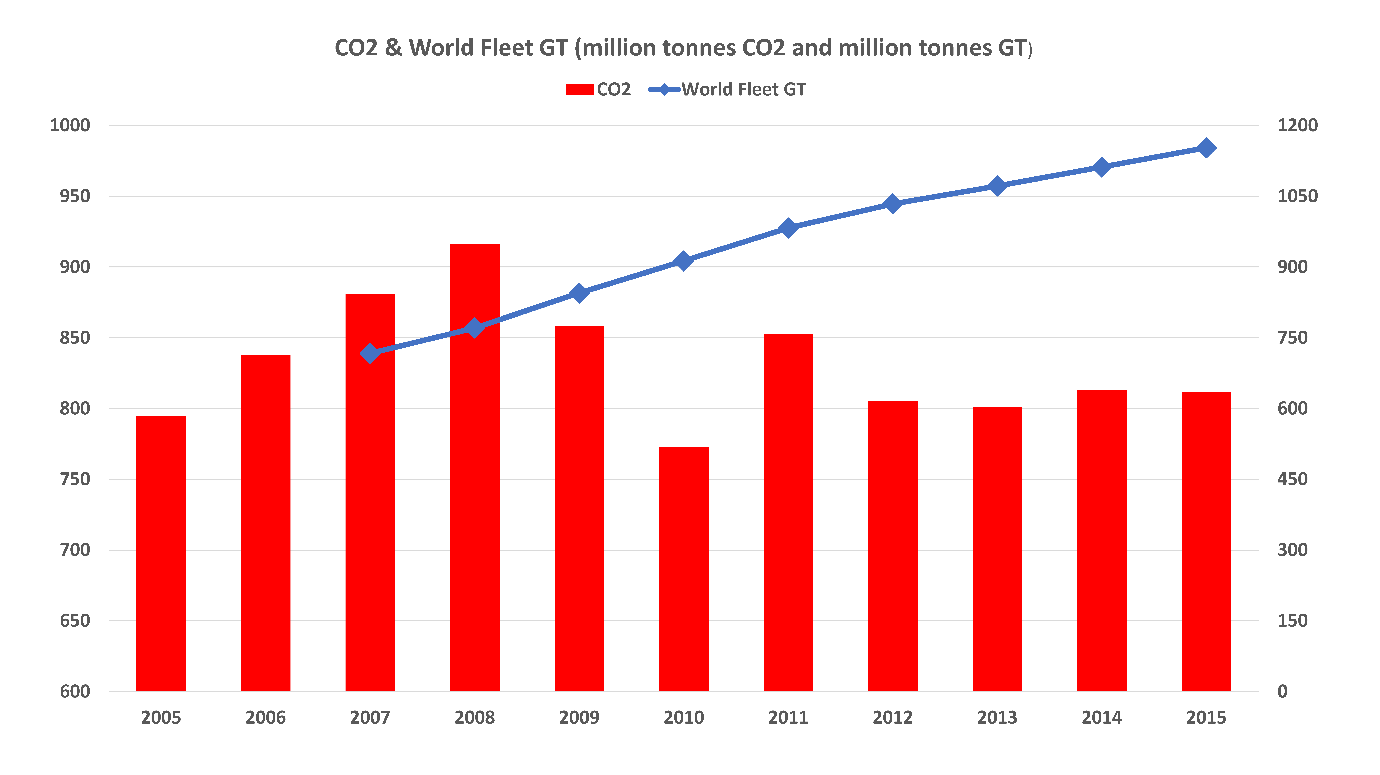
Now we all know that growth in cargo demand has been met with a growth in shipping capacity, both in numbers and in sizes. But how did the fleet change in those years? The CO2 graph for the same time period is included for context.

Fleet GT source: UK Government statistics
The statistics excludes all vessels below 100 GT, so most fishing vessels and some domestic shipping are not included, which is why I'm using CO2 emissions for international shipping rather than all shipping. They don't correspond exactly, but I think the error is acceptable when looking at trends. The publicly available statistics I'm using also don't go earlier than 2007, but it is probably reasonable to assume that world GT has kept up with cargo demand growth. You might be wondering why I've used GT rather than DWT; I can assure you that the picture in DWT is very similar - the comparison was so uneventful that I didn't think it worth reproducing here.
Note that scale and axis choices can seriously affect your perception of the data:
Taking the period 2007-2015 (purely because I have the most complete data for this period):
Tonne miles grew from 40759 billion tonne miles to 53589 billion tonne miles, an increase of about 31%
Tonnes loaded grew from 8034 million tonnes to 10048 million tonnes, an increase of about 25%
Fleet GT grew from 717 million tonnes to 1134 million tonnes, an increase of about 58%
CO2 fluctuated from a peak of 916 million tonnes in 2008 to hovering around 801-813 million tonnes in the years 2012-2015, a decrease of about 11%
You can probably spot one obvious reason why shipping is suffering from overcapacity issues, but I digress. Cargo demand and fleet capacity have grown between 2007-2015, while CO2 emission has decreased. By some measures, certain sectors of shipping were already the most efficient form of transport in terms of CO2 emitted per tonne mile of cargo moved, so this further improvement is not to be sniffed at. On the other hand we are still a long way from where we need to be for a 2 or 1.5 degree scenario.
The inevitable comparison is drawn with aviation who have agreed to carbon neutral growth from 2020 onwards – the above certainly looks like close to carbon neutral growth without resorting to offsetting or international regulation. None of which is to say that shipping should rest on its laurels.
So are ships the most efficient they have ever been, or is efficiency going backwards? I'll attempt to answer that in part 2.